
If you want to host your own uptime monitoring, start with Uptime Kuma. It's the best all-round choice for most people, with a polished interface, a long list of monitor types, built-in status pages and the largest community in the category.
Gatus is the better fit if you want your monitoring defined in YAML and committed next to your infrastructure. Upptime runs entirely on GitHub if you're happy with a check every five minutes. And if what you really need is infrastructure monitoring rather than website uptime, Zabbix or Checkmk belong on the shortlist instead.
All of them run without a monthly software bill. The trade is that you own the server, the updates, the backups, the alert delivery and, as this guide gets into, the monitoring network itself. This guide was updated in October 2026 to reflect each project's current release and now compares six of the strongest self-hosted options.
The Comparison
| Tool | Best for | Check interval | Configuration | Status page | Global monitoring |
|---|---|---|---|---|---|
| Uptime Kuma | Best overall | Down to 20 seconds | Web UI | Yes | DIY |
| Gatus | Configuration as code | Any, 60 seconds by default | YAML | Yes | DIY |
| Upptime | GitHub-native monitoring | 5 minutes at best | YAML in a GitHub repo | Yes, on GitHub Pages | No |
| Statping-ng | Simple monitor plus status page | Configurable | Web UI and API | Yes | DIY |
| Zabbix | Infrastructure monitoring | Configurable | Web UI, API, templates | Limited | Distributed, DIY |
| Checkmk Raw | Infrastructure and networks | 1 minute by default | Web UI and config files | Limited | Distributed, DIY |
"DIY" in the last column means the software checks from wherever you install it, and running it from more than one place is a project of your own. More on that below, because it's the line that decides most of these choices.
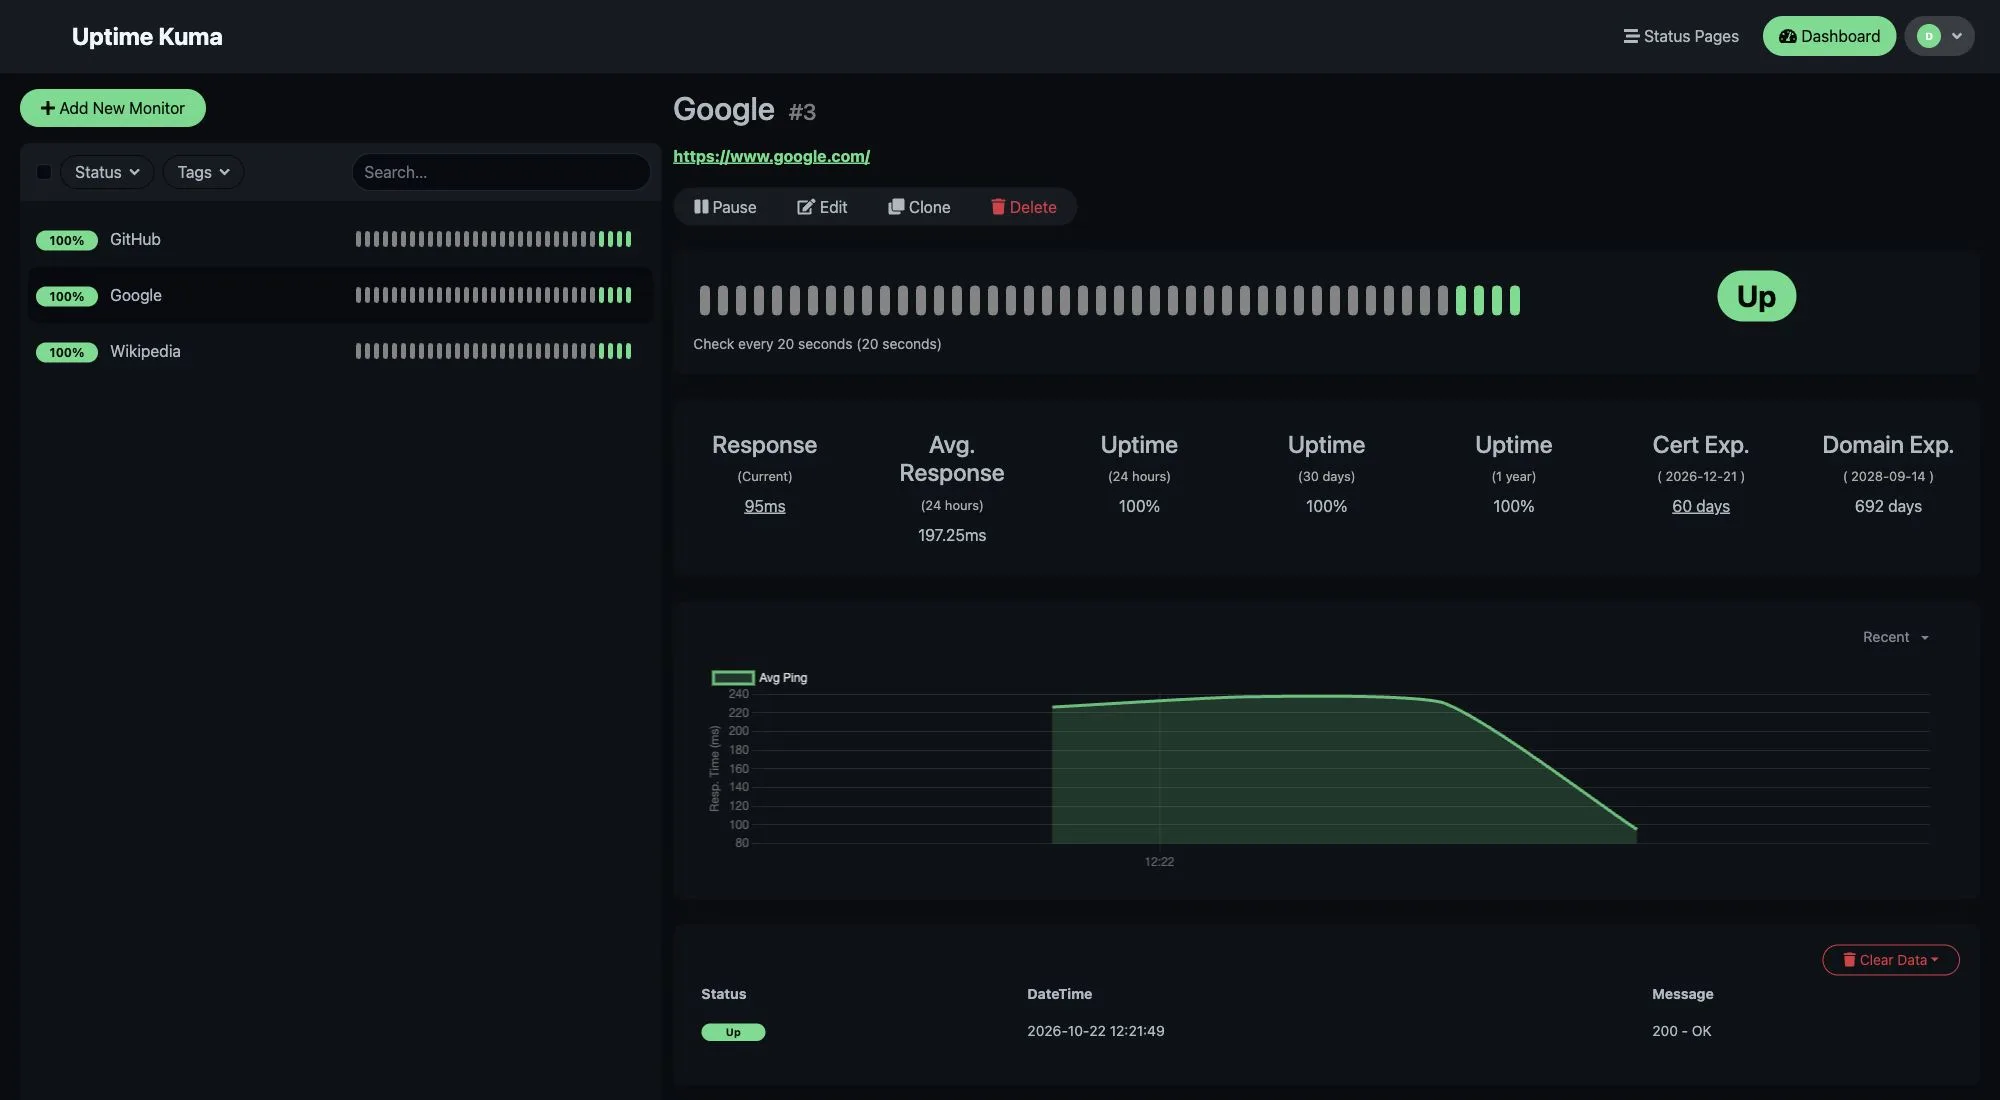
Uptime Kuma
Actively maintained · 2.5.6 released October 9, 2026 · about 93,000 GitHub stars
The one most people mean when they say "open-source uptime monitoring." Uptime Kuma earns the reputation. The 2.x line, which went stable in late 2025, added a MariaDB option alongside SQLite, a refreshed interface, rootless Docker, and it's still adding monitor types and notification providers every few weeks.
Out of the box you get HTTP and HTTPS checks, keyword and JSON query checks, TCP ports, ping, DNS records, push monitors for heartbeats, Docker container checks and a long tail of game server and protocol monitors. Notifications cover email, Slack, Discord, Telegram, Teams, PagerDuty, ntfy, webhooks and dozens more. Status pages are built in and can be branded. Two-factor sign-in is there. It installs in minutes with one Docker command and most people never touch anything beyond the web UI.
Where it's weaker is the things a UI-first tool is always weaker at. Configuration lives in the database rather than in files, so putting your monitors under version control takes a plugin or an export habit. And the whole thing is one process on one box, checking from one place.
If you want a self-hosted monitor for a handful of services and you're comfortable running Docker, it's hard to beat as the starting point. For a lot of readers of this page, it's also the finishing point, and that's fine.
Gatus
Actively maintained · 5.37.0 released September 24, 2026 · about 12,000 GitHub stars
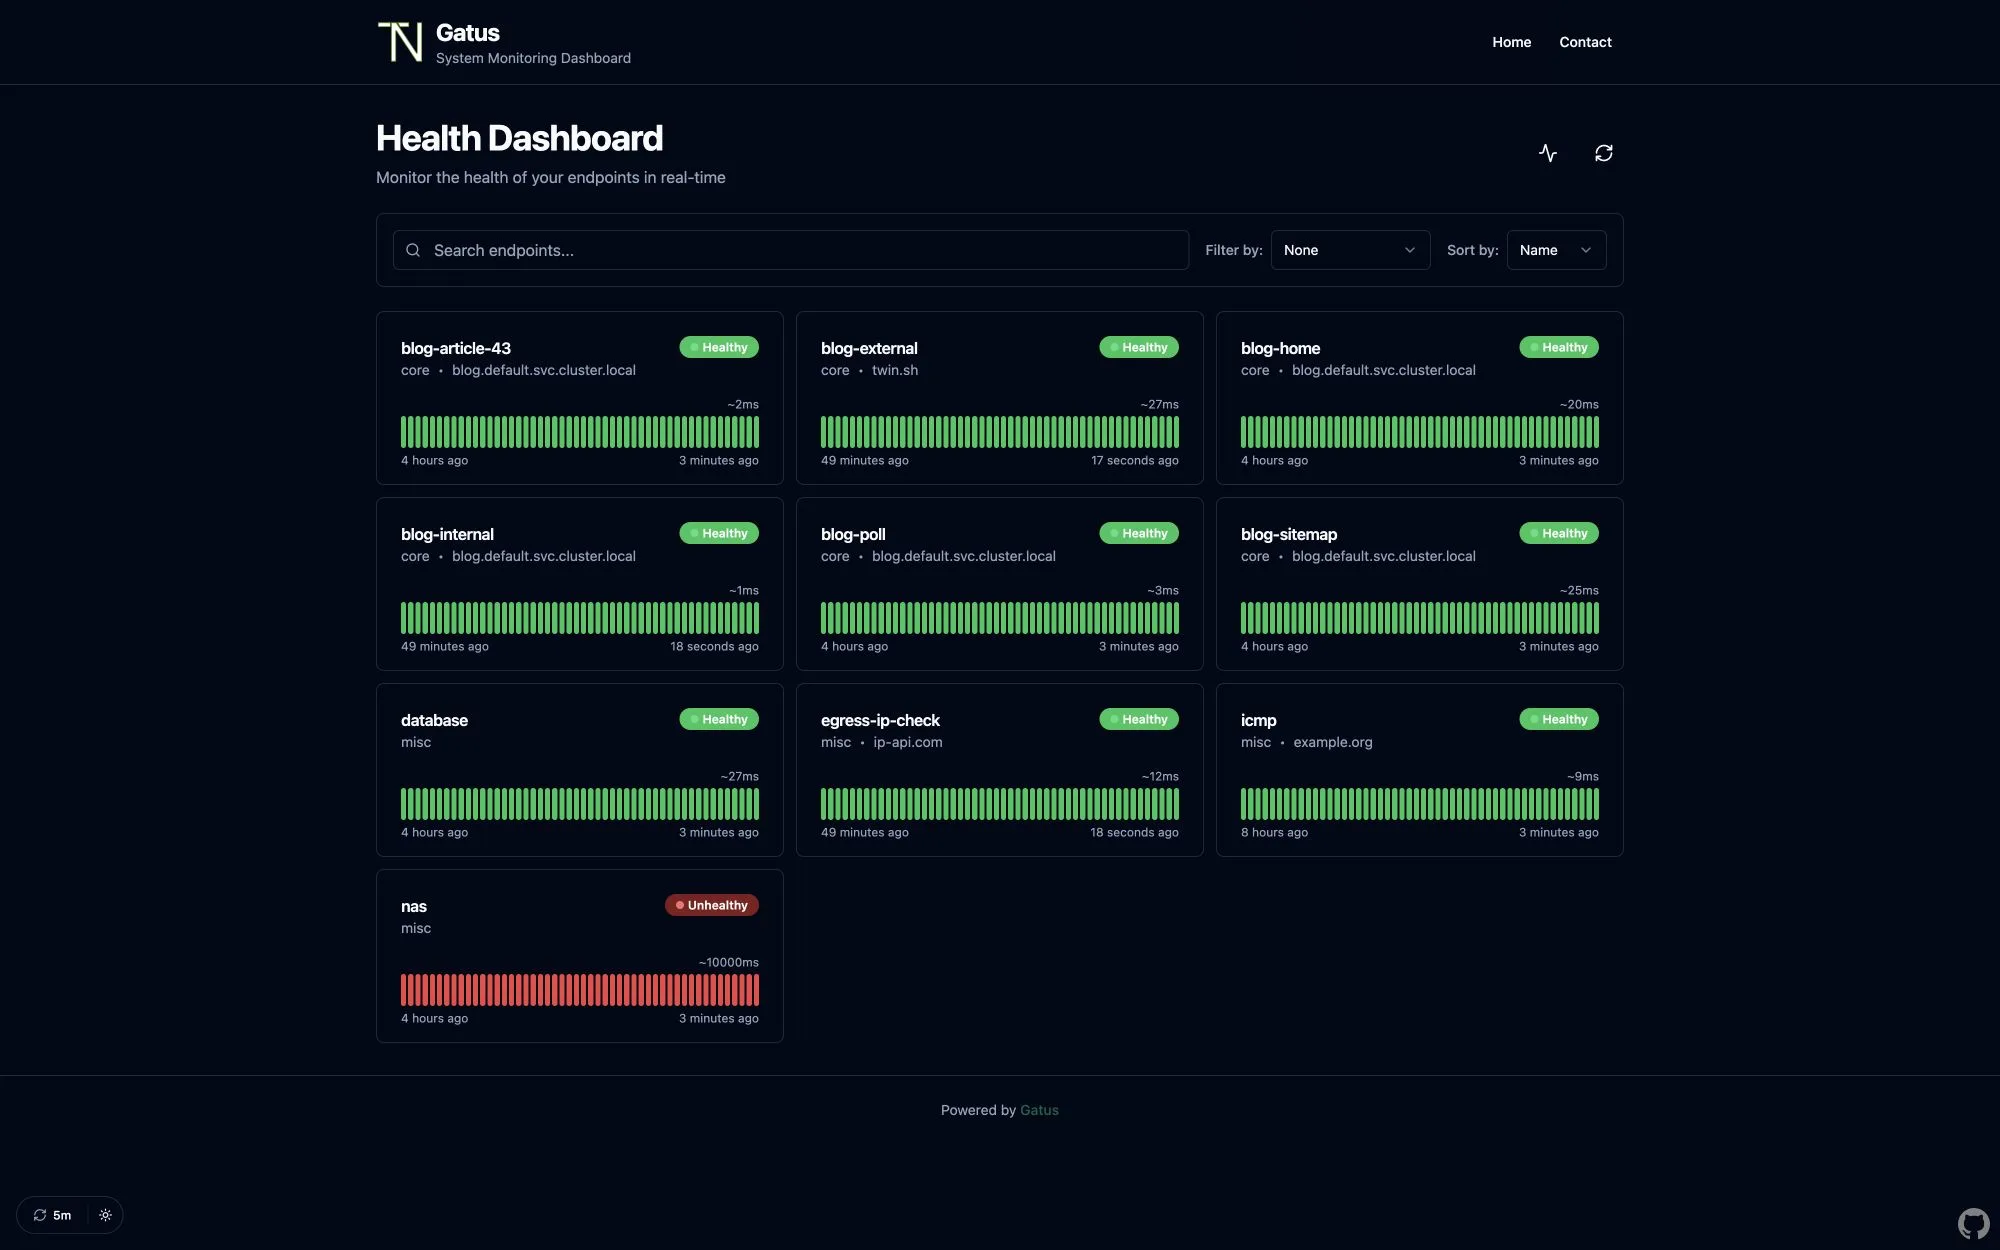
Gatus is monitoring as configuration. You describe each endpoint in YAML, with a URL, an interval and a list of conditions it must satisfy, such as a status code, a response time ceiling, a body field or a certificate that's valid for at least so many days. Commit the file, deploy the single binary or container, and Gatus serves a clean status page with history and response times.
It covers more ground than people expect. HTTP, ICMP, TCP, DNS, gRPC, WebSocket, SSH, STARTTLS and TLS expiry are all checkable from the same file. There are more than two dozen alerting providers, Prometheus metrics, SQLite or Postgres for history, and the page can sit behind basic auth or OIDC.
The trade is that there's no UI for editing. That's the point for a GitOps team and a dealbreaker for anyone who wants to add a monitor from their phone. If your infrastructure already lives in a repository and goes through review, Gatus fits that workflow better than anything else here.
Upptime
Actively maintained · rolling releases from a template repository · about 17,000 GitHub stars
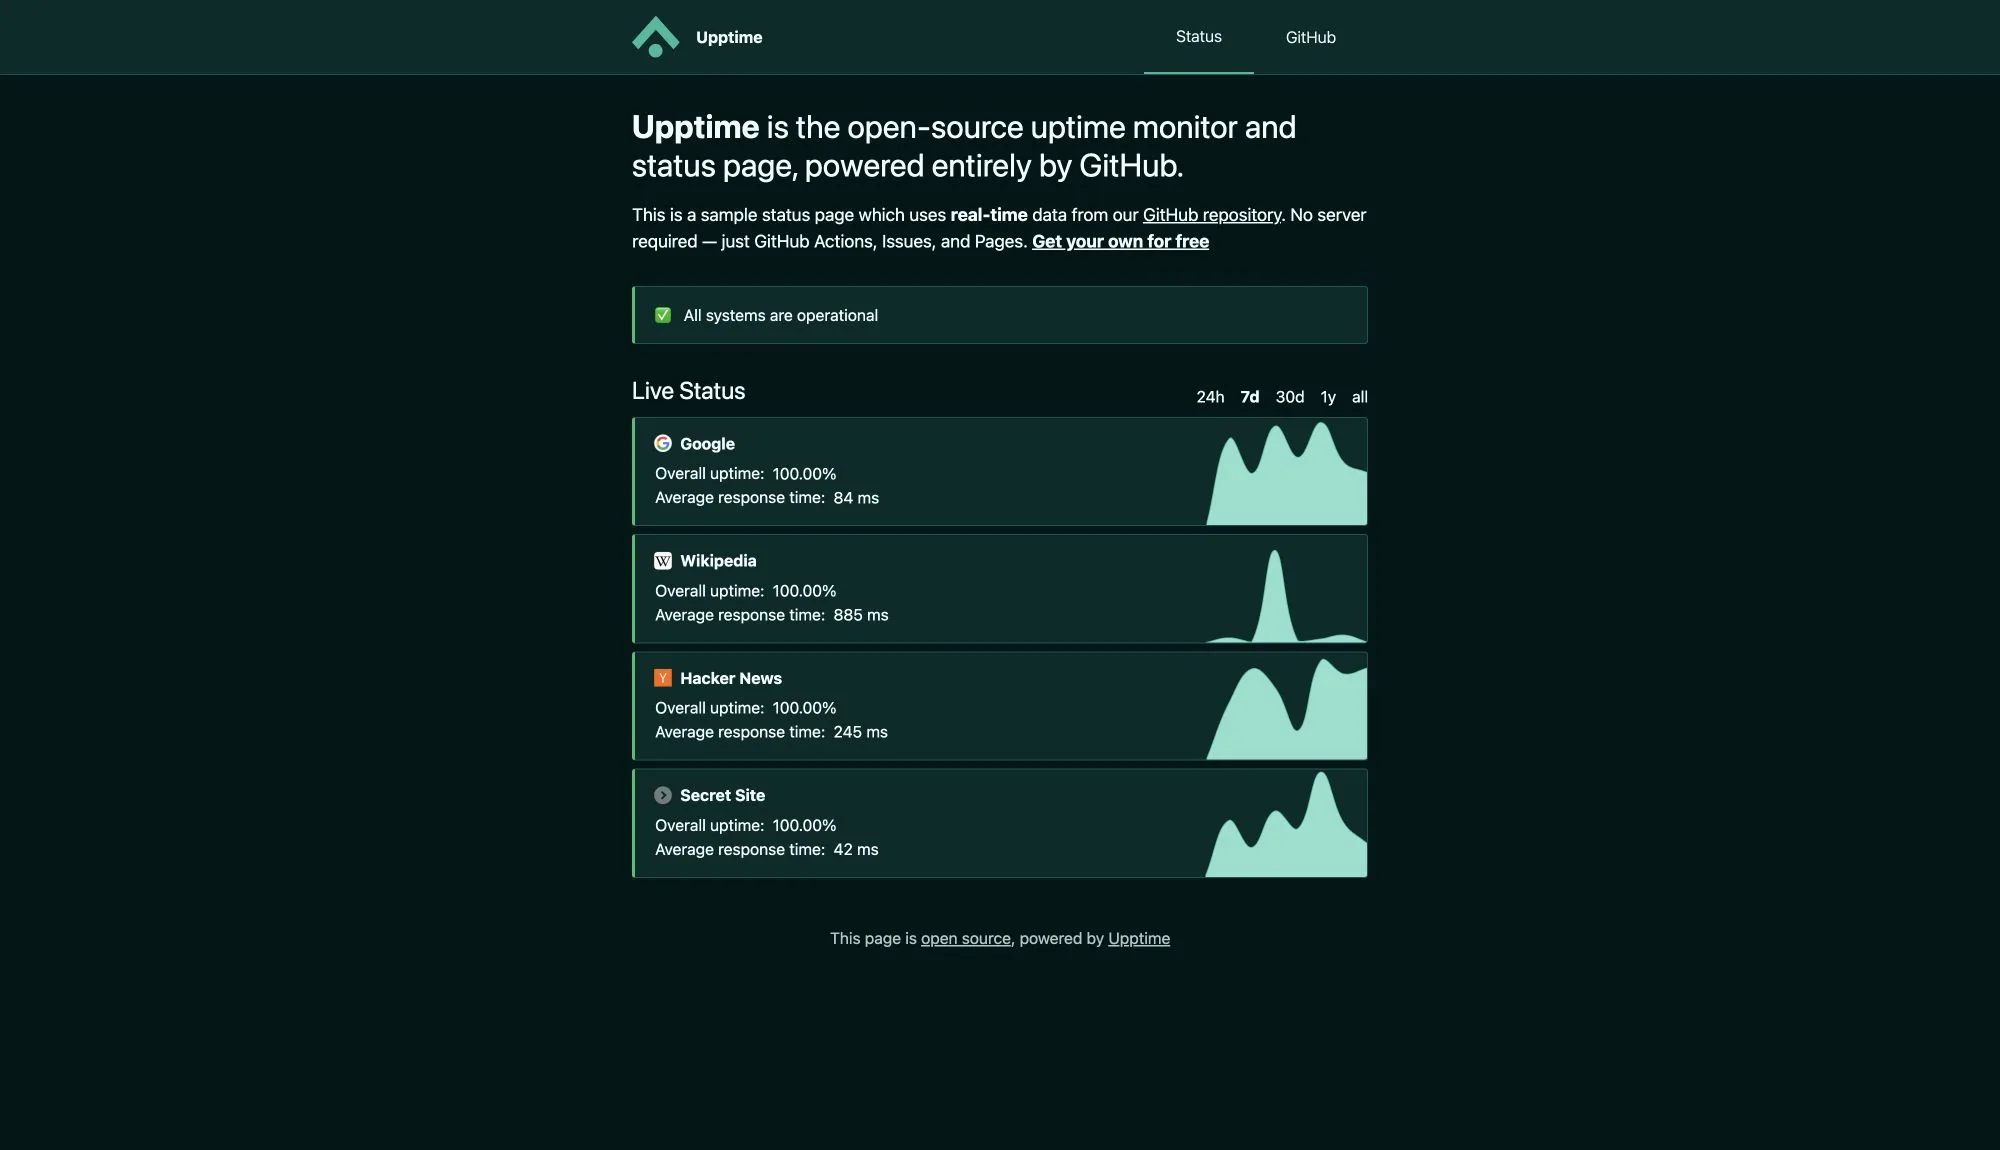
Upptime is the clever one. There's no server at all. A GitHub Actions workflow runs your checks on a schedule, downtime opens a GitHub Issue, recovery closes it, and a status page is published to GitHub Pages. You create a repository from the template, list your sites in a YAML file, and you're monitoring.
The limits come straight from where it runs. GitHub's scheduler won't go below five minutes, so that's the floor for every check, and in practice scheduled workflows can drift later than that under load. Response times are sampled far less often than uptime. The runners live in GitHub's own US infrastructure, so this is a single vantage point like the rest, with no option to add more. And on a private repository the Actions minutes come out of your plan.
For a public project, a side project or anything where five minutes is fine and you'd rather not run a server, it's a genuinely good answer.
Statping-ng
Slower cadence · 0.93.0 released June 2025 · about 2,000 GitHub stars
Statping-ng is the community continuation of Statping, a Go monitor and status page in one. It handles HTTP, TCP, ICMP and gRPC checks, has a decent set of notifiers, a public status page with a mobile app, and a REST API. It's simple to run and easy to like.
The honest note is cadence. The last release and the last commit were both in June 2025, so it's more than a year behind Uptime Kuma and Gatus, which both shipped this month. It still works, and nothing in a monitoring tool goes stale fast, but if you're choosing today for the next few years, choose with that in mind.
Zabbix
Zabbix is the heavyweight. It monitors servers, containers, network devices, databases and applications through agents, SNMP and a huge template library, and it scales to tens of thousands of hosts. Website checks exist as web scenarios, and distributed monitoring through proxies lets you check from several of your own locations.
It's also a long way past "is my website up?" You'll spend days on setup and the learning curve is real. If you have the infrastructure problem, Zabbix is a serious answer to it. If you have the website problem, it's a lot of machinery for a GET request.
Checkmk Raw
Checkmk's Raw Edition is the free, open-source tier of a commercial product, built on a Nagios core with Checkmk's own agents, auto-discovery and a far better interface than Nagios ever had. Like Zabbix, its strength is hosts, services and networks, with website checks available as active checks and distributed monitoring for multiple sites.
The same verdict applies. Right tool for an infrastructure team, overkill for uptime alone, and the Raw Edition holds back some features for the paid editions.
Projects You May Still Run Into
Cabot was a popular Django-based alternative to PagerDuty-style alerting. Its last commit was in September 2023, so I'd treat it as dormant. Cachet is excellent and actively maintained, but it's a status page system, not a monitor. It shows the status you tell it, so it pairs with one of the tools above rather than replacing them.
What Self-Hosting Really Costs
The software is free. The system around it isn't. Before you commit, budget honestly for:
- Setup. Docker, a reverse proxy, TLS, persistent storage, backups and notification credentials, all wired correctly, all once.
- Upkeep. OS patches, image upgrades, database migrations and the occasional breaking change you'll read release notes to survive. Uptime Kuma 2.0 changed badge endpoints, backup formats and retry defaults, and that's the well-run project.
- The server. A small VPS is cheap. It's also one more machine to secure, keep online and remember exists.
- The watcher problem. Your monitor runs on one box. If that box, its network or its data centre has a bad day, you lose visibility at the exact moment you need it, and nothing is watching the watcher.
None of this is a dealbreaker. It's real, recurring work that a "$0" price hides. The honest comparison was never free versus paid. It's your time and your infrastructure versus a subscription. I went through that trade in detail in Sentinel vs Uptime Kuma.
The Hard Part: Monitoring From More Than One Place
A self-hosted monitor sees the internet from wherever you install it.
Run Uptime Kuma on a VPS in Virginia and you know whether Virginia can reach your site. That's useful. It isn't the same as knowing whether your site is reachable from Europe, from Asia, from South America, or from a different network in the same country. A routing problem between your one box and your site reads as an outage. A real outage that your one box can still reach reads as fine.
You can solve this yourself. Put a node in each region you care about, keep every one of them patched and online, collect their results somewhere central, decide how many of them have to agree before an alert goes out, make sure the alerts still go out when one node is the thing that's down, and do all of that again every time you upgrade. At that point you haven't set up an uptime monitor. You've started building monitoring infrastructure, and it needs its own monitoring.
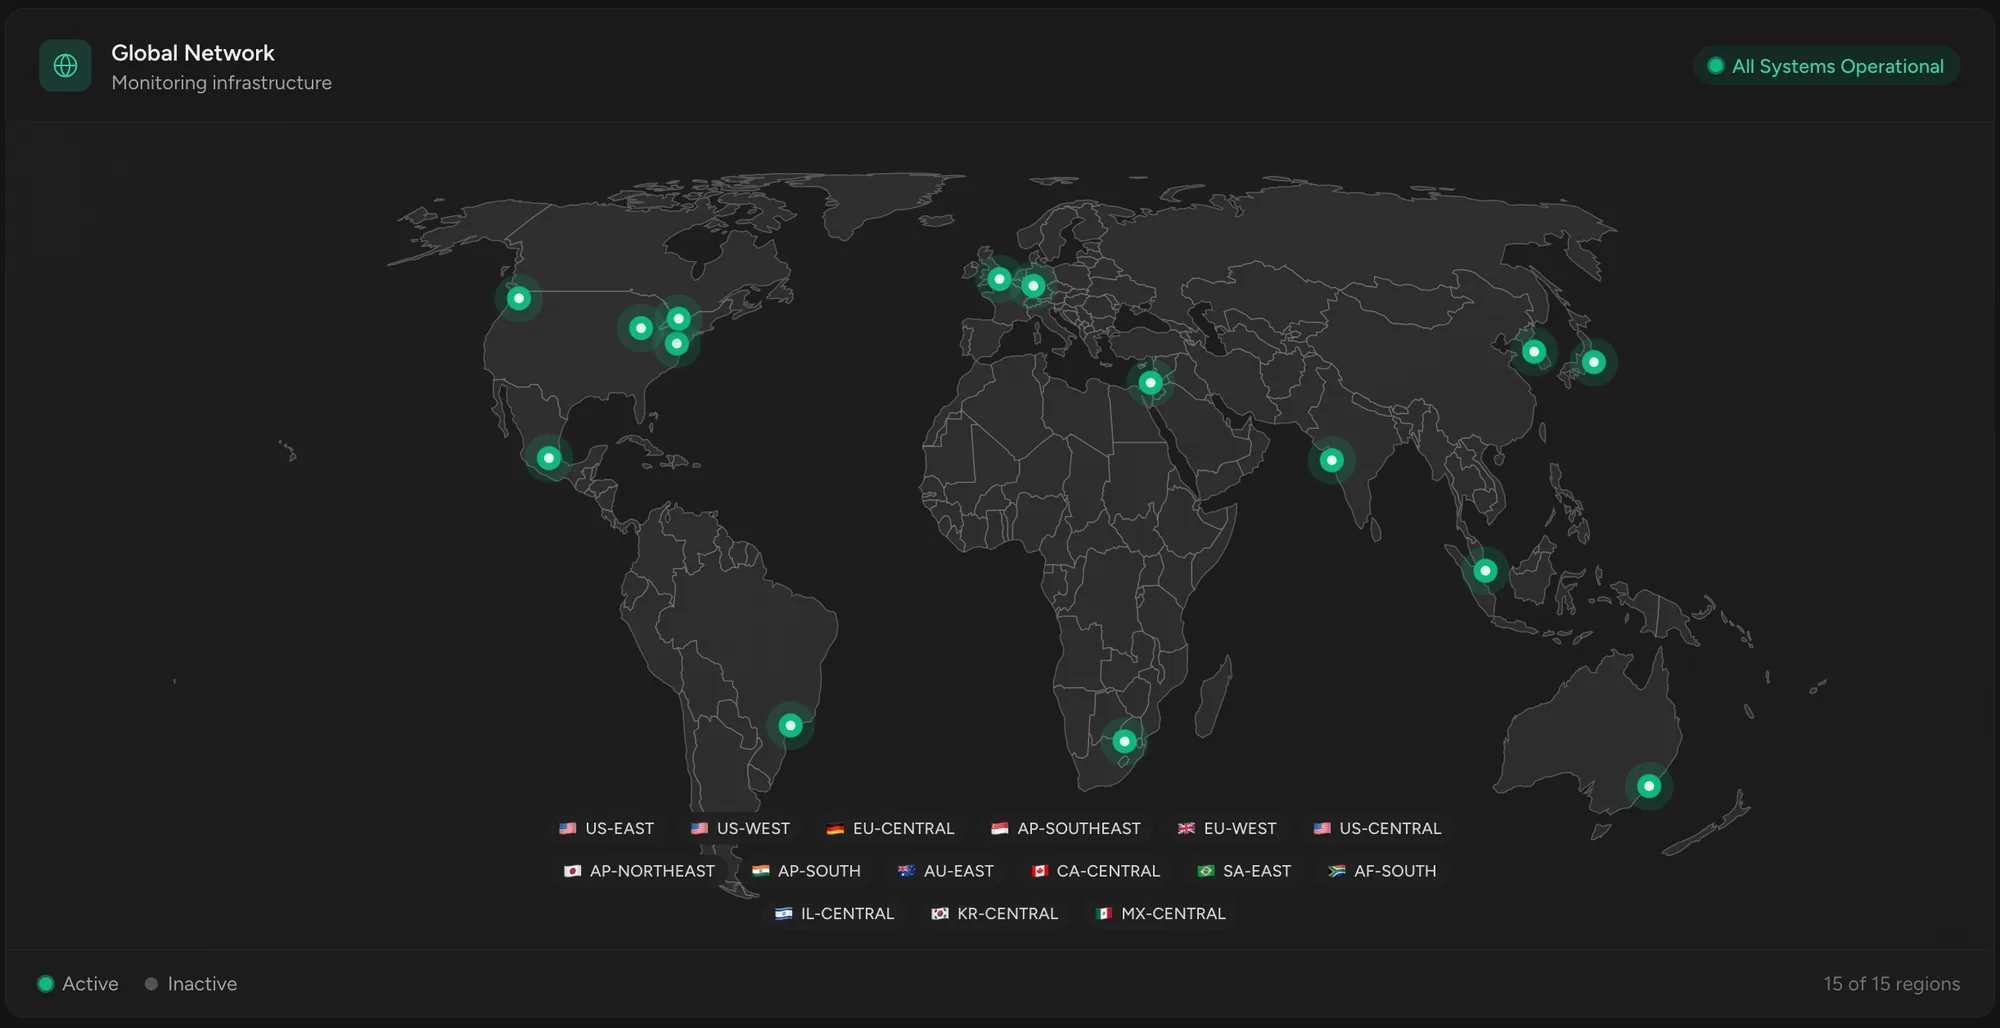
That's the clearest dividing line between self-hosted and hosted monitoring. Sentinel runs every check from fifteen regions on six continents and needs at least half of them, three or more on two continents, to agree before it opens an incident. The consensus model is the product. With a self-hosted tool, that network is yours to build and operate, and almost nobody does. Most self-hosted setups stay single-region for years, and the first time they find out is a false alarm at 3am or a real outage they never saw.
Uptime Kuma is excellent. If what you want is Uptime Kuma, use Uptime Kuma. But self-hosting an uptime monitor and operating a globally distributed monitoring network are two different things, and the second one is the part you can't download.
Open Source or Hosted?
A quick gut check. Self-hosting is the right call when:
- You're monitoring personal projects or internal services and you enjoy running your own infrastructure.
- Data residency or an air-gapped environment rules out a third party.
- You have the time, and the inclination, to own the upkeep.
- One vantage point is genuinely enough for what you're watching.
A hosted service tends to win when:
- Monitoring is critical and you can't afford the watcher to share a fate with what it watches.
- You need to know your site is reachable from where your users are, not just from your server.
- You're accountable to clients or a team, and your hours are the most expensive thing in the equation.
- You want an API, Terraform, a CLI or an AI assistant talking to your monitoring without building any of it.
Where Sentinel Fits
Self-host the software, or use the network.
Sentinel is the second option. Every plan, the free one included, runs every check from all fifteen regions, with consensus before anything alerts you, as often as every 15 seconds depending on plan. Uptime monitoring comes with SSL, DNS and domain expiry checks on every monitor, plus keyword and content checks, JSON assertions for APIs, ping, port, heartbeat and cron monitoring. There are branded status pages, a REST API, a CLI, a Terraform provider and an MCP server so Claude or ChatGPT can read and manage your monitoring in plain language. SentinelBot is a verified bot in Cloudflare's directory and publishes its IPs for allow-listing.
There's nothing to patch, back up or keep online, and nothing watching the watcher is my problem rather than yours. The free plan is 10 monitors with no credit card, so the cheapest way to settle this is to run it next to your Uptime Kuma for a week and compare what each one saw.
If you're weighing the move, the head-to-head is in Sentinel vs Uptime Kuma, the wider field is in the best uptime monitoring tools, and add your first monitor takes about a minute.